
How to Use Analytics to Grow Your Etsy Shop
Why Data Beats Gut Feeling
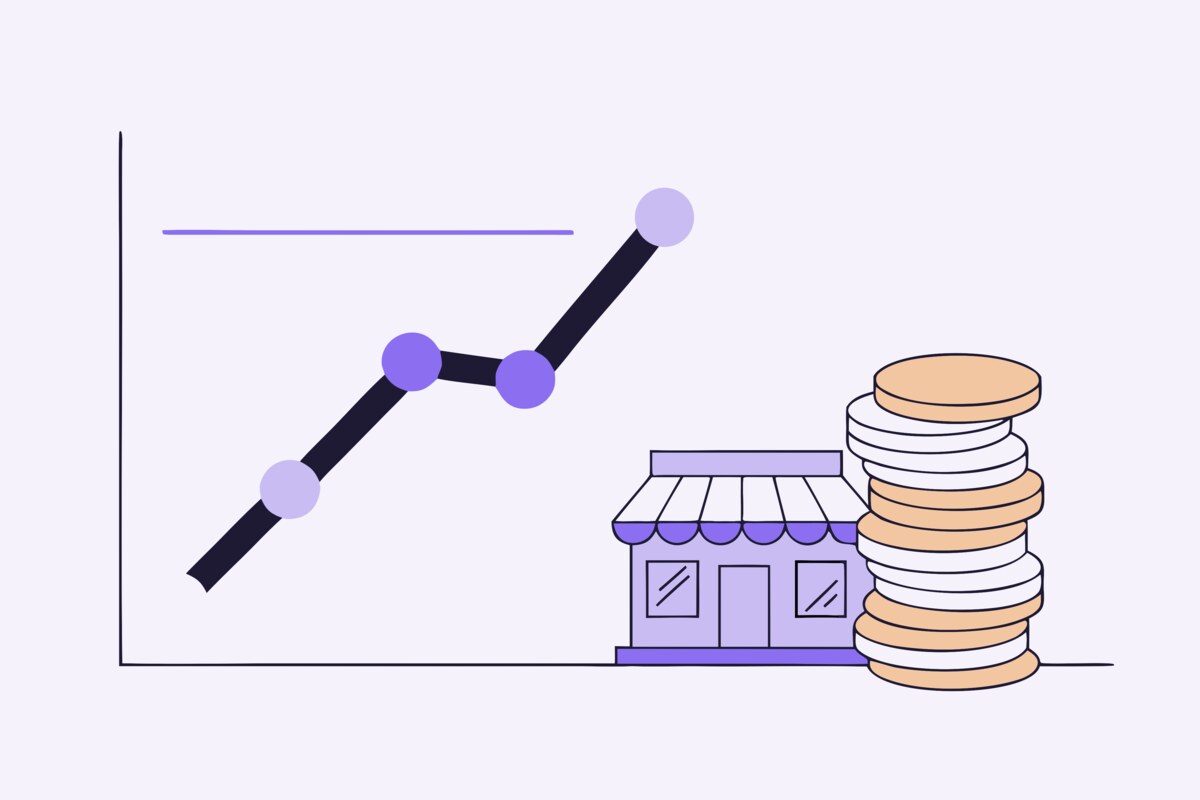
Many Etsy sellers operate on intuition — creating products they think will sell, pricing based on what feels right, and hoping their listings are optimized enough. While intuition has its place, data-driven decision making consistently outperforms gut feeling when it comes to growing a shop.
The sellers who scale beyond hobbyist income are almost always the ones who track their numbers, identify patterns, and make strategic decisions based on what the data shows. The good news is that you don't need a statistics degree — you just need to know which metrics matter and how to act on them.
The Metrics That Actually Matter
Views and Visits
Views count how many times your listings are seen in search results and browse pages. Visits count how many times someone actually clicks through to your listing page. The ratio between these two numbers is your click-through rate (CTR), and it's one of the most revealing metrics available to you.
A low CTR (lots of views but few visits) suggests your thumbnail image and title aren't compelling enough to earn the click. A high CTR but low sales suggests the listing page itself isn't converting — perhaps the price, description, or additional photos need work.
Conversion Rate
Your conversion rate is the percentage of visits that result in a sale. The average Etsy conversion rate hovers around 1-3%, meaning that for every 100 visitors, 1-3 make a purchase. If your conversion rate is significantly below this range, your listing pages need improvement. If it's above 3%, your optimization is working well and you should focus on driving more traffic.
Track conversion rates per listing, not just shop-wide. Individual listing conversion rates reveal which products are resonating with buyers and which are failing to close the deal despite getting traffic.
Traffic Sources
Etsy Stats shows where your traffic comes from: Etsy search, direct visits, social media, and external sources like Pinterest or Google. This breakdown tells you which channels are delivering results and where to invest more effort.
If most of your traffic comes from Etsy search, your SEO is working. If you're getting significant Pinterest traffic, your pin strategy is paying off. If certain channels are underperforming, you know where the growth opportunity lies.
Search Terms
Etsy shows you the search terms buyers used to find your listings. This data is gold for optimization. If buyers are finding you through terms you hadn't considered, add those terms to your tags and titles. If your target keywords aren't showing up in your search terms, your listings may need better optimization for those specific phrases.
Setting Up a Weekly Analytics Routine
Data is only valuable if you review it regularly. Establish a weekly 15-minute analytics review:
Monday review: Check the previous week's views, visits, and sales. Compare to the week before. Are numbers trending up, down, or flat? If there's a significant change, investigate which listings or traffic sources are responsible.
Top performers: Identify your top 5 listings by views and sales. What do they have in common? Can you apply those patterns to your other listings?
Underperformers: Identify listings with high views but low conversions, or low views despite good health scores. These are your highest-impact optimization targets.
Search terms: Review the top search terms driving traffic. Are there new terms appearing? Are there high-value terms where you should create or optimize listings?
Making Data-Driven Decisions
Analytics should inform specific actions, not just be interesting numbers to look at. Here are common data patterns and what to do about them:
High views, low clicks: Your listing appears in search but doesn't get clicked. Improve your primary photo and title — these are the only elements buyers see in search results.
High clicks, low sales: Buyers are interested but not purchasing. Review your pricing (is it competitive?), description (does it answer all questions?), photos (do they show enough detail?), and reviews (do you have social proof?).
Seasonal patterns: If certain products spike during specific months, plan ahead. Create seasonal variations, update tags and titles with seasonal keywords 6-8 weeks before the peak, and ensure adequate inventory.
Traffic source shifts: If Pinterest traffic is growing while Etsy search traffic is flat, double down on Pinterest by pinning more frequently and optimizing pin descriptions.
Beyond Basic Etsy Stats
Etsy's built-in analytics are helpful but limited. They show you what's happening but don't always tell you why or what to do about it. This is where supplementary tools add significant value.
ShopBoostly's analytics complement Etsy Stats by connecting the dots between listing quality and performance. You can see not just that a listing is underperforming, but specifically what aspects of its optimization are holding it back. Combine this with Etsy's traffic and sales data, and you have a complete picture that turns raw numbers into a clear action plan for growth.
Related Articles
How AI is Revolutionizing Etsy Selling in 2026
Explore how artificial intelligence tools are helping Etsy sellers optimize listings, save time, and increase sales.
AI-Powered Listing Optimization: What It Is and How It Works
Understand how AI analyzes your Etsy listings and provides specific, actionable suggestions to improve your titles, tags, and descriptions.
The Etsy Seller's Guide to Listing Health Scores
Learn what listing health scores measure, why they matter, and how to use them to systematically improve your Etsy shop.
Ready to boost your Etsy shop?
Try ShopBoostly and start optimizing your listings today.
Join early access